
Real EstateFeatured project
Real Estate Company Reporting
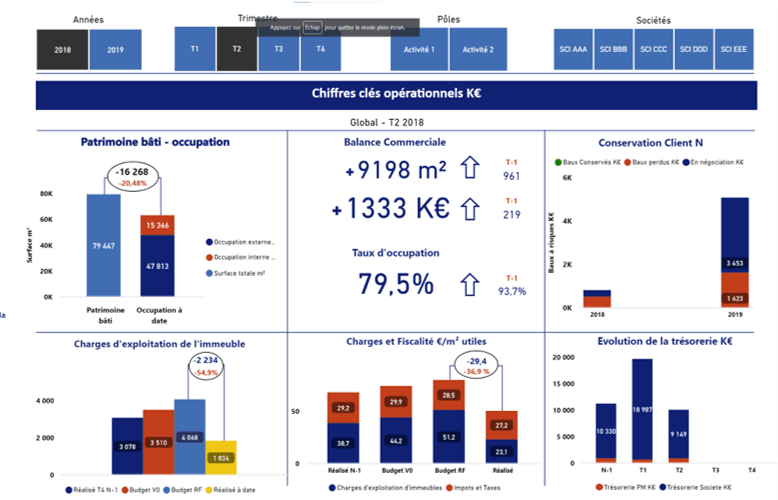
Consolidated dashboard for a major commercial real estate player
Power BIPower BI ServicePower AutomateDAX
Context
A major commercial real estate player engaged us to build a Power BI dashboard consolidating their accounting, budgetary, and operational data from various sources (financial systems, external valuations, rental data, etc.). The goal: to have a single management tool allowing senior management, asset managers and financial controllers to monitor group and entity performance in a reliable, dynamic and visual way.
Challenges to address
- xData scattered across multiple systems (financial IT, valuations, property management)
- xNeed for multi-level consolidated and analytical views
- xVarious users: CEO, asset managers, financial controllers
- xNeed to access General Ledger details in the same tool
Solutions implemented
- +Data source audit: General ledger, budgets, asset valuations, property management
- +Power BI cube modeling enabling consolidated and analytical analysis
- +Dashboard UX design with hierarchical views: group → entity → asset → account
- +Direct General Ledger exploration with dynamic filters (company, period, activity type)
- +Automated data refresh via Power BI Service + Power Automate
- +Key user training and onboarding documentation
Results achieved
Unified View
Consolidated performance and budget variances in real-time
Quick Analysis
Financial impact of assets by location or legal nature
Direct Access
Accounting entries accessible in the same tool (no more Excel exports)
Strong Adoption
Intuitive design and customized business filters